Minisforum MS-01

Notice: Page may contain affiliate links for which we may earn a small commission through services like Amazon Affiliates or Skimlinks.

berkyl

New Member
Jan 13, 2025
25
3
3
I have a similar setup, without the 25Gbe adapter. I have

  • 5x MS01
  • Same memory
  • 15x Crucial T500 2TB (3 per node)
  • Also running Proxmox
  • Also running Ceph (using 10 OSDs, 2 NVME drives per node)
  • The slowest NVME slot is used for booting each node
Ceph is configured with dedicated 10gb nic for frontend and the other 10gb nic is for Ceph backend. All in all I think it's a very similar setup to what you have. The performance I get is about right on the mark with what I'd expect from consumer drives. Note that consumer drives perform nicely until the cache is filled, and then performance falls dramatically. To avoid the falloff, you'll need enterprise NVME drives. You can see this in my rados-bench chart:

View attachment 41306
I'm not sure your benchmark is actually on the mark. It's about what I get from 3 Intel NUCs, single NVMe with 2.5Gbe networking for frontend/proxmox and dedicated 18Gbe networking on the thunderbolt in a mesh network.
Do you use jumbo frames and a dedicated switch?

Would you mind fio'ing your nvme on the host on slot 1 or 2 with
`fio --filename=/dev/nvme0n1 --ioengine=libaio --direct=1 --rw=write --bs=4k --numjobs=1 --iodepth=32 --runtime=60 --time_based --group_reporting --name=test`?
My rados bench was at around 1431MB/s but with very low IOPS, that's why I started debugging.
 

meyergru

New Member
Jul 12, 2020
26
2
3
That drive seems really slow. Even the sustained write speed of that type should be 3-4 GByte/s. Note that this is totally different from the other results, which are perfectly explainable.

I could think of possible causes:

1. M.2 slot with slower PCIe or less lanes?
2. Counterfeit product? Those products are often faked: https://www.reddit.com/r/Seagate/comments/ivwql7 3. Obviously, the same decay problems as with the KC3000 riddle the 530R, as it has the same Physon E18 controller:


P.S.: Do not use fio on a raw disk unless it is not being used for a filesystem! And as I said, tests with bs=4k and sync=1 will give results way below expectations.
 

berkyl

New Member
Jan 13, 2025
25
3
3
I put the KC3000 in another host, ran ubuntu live and executed the same tests again:

Bash:
ubuntu@ubuntu:~$ sudo fio --filename=/dev/nvme0n1 --ioengine=libaio --direct=1 --sync=1 --rw=write --bs=4k --numjobs=1 --iodepth=32 --runtime=60 --time_based --group_reporting --name=test~
test~: (g=0): rw=write, bs=(R) 4096B-4096B, (W) 4096B-4096B, (T) 4096B-4096B, ioengine=libaio, iodepth=32
fio-3.36
Starting 1 process
Jobs: 1 (f=1): [W(1)][100.0%][w=13.0MiB/s][w=3319 IOPS][eta 00m:00s]
test~: (groupid=0, jobs=1): err= 0: pid=8404: Mon Jan 13 15:57:16 2025
  write: IOPS=3279, BW=12.8MiB/s (13.4MB/s)(769MiB/60009msec); 0 zone resets
    slat (nsec): min=1057, max=241739, avg=6972.64, stdev=3547.29
    clat (usec): min=6970, max=30484, avg=9748.84, stdev=820.66
     lat (usec): min=7023, max=30489, avg=9755.82, stdev=820.83
    clat percentiles (usec):
     |  1.00th=[ 9241],  5.00th=[ 9241], 10.00th=[ 9241], 20.00th=[ 9241],
     | 30.00th=[ 9241], 40.00th=[ 9241], 50.00th=[ 9503], 60.00th=[ 9765],
     | 70.00th=[10028], 80.00th=[10290], 90.00th=[10552], 95.00th=[10683],
     | 99.00th=[11469], 99.50th=[12518], 99.90th=[21103], 99.95th=[23462],
     | 99.99th=[25297]
   bw (  KiB/s): min=12024, max=13352, per=100.00%, avg=13126.37, stdev=327.03, samples=119
   iops        : min= 3006, max= 3338, avg=3281.59, stdev=81.76, samples=119
  lat (msec)   : 10=68.71%, 20=31.17%, 50=0.12%
  cpu          : usr=1.39%, sys=4.10%, ctx=196949, majf=0, minf=10
  IO depths    : 1=0.1%, 2=0.1%, 4=0.1%, 8=0.1%, 16=0.1%, 32=100.0%, >=64=0.0%
     submit    : 0=0.0%, 4=100.0%, 8=0.0%, 16=0.0%, 32=0.0%, 64=0.0%, >=64=0.0%
     complete  : 0=0.0%, 4=100.0%, 8=0.0%, 16=0.0%, 32=0.1%, 64=0.0%, >=64=0.0%
     issued rwts: total=0,196808,0,0 short=0,0,0,0 dropped=0,0,0,0
     latency   : target=0, window=0, percentile=100.00%, depth=32

Run status group 0 (all jobs):
  WRITE: bw=12.8MiB/s (13.4MB/s), 12.8MiB/s-12.8MiB/s (13.4MB/s-13.4MB/s), io=769MiB (806MB), run=60009-60009msec

Disk stats (read/write):
  nvme0n1: ios=107/196410, sectors=6000/1571280, merge=0/0, ticks=24/1913873, in_queue=1913897, util=99.93%
Bash:
ubuntu@ubuntu:~$ sudo fio --filename=/dev/nvme0n1 --ioengine=libaio --direct=1 --rw=write --bs=128k --numjobs=1 --iodepth=32 --runtime=60 --time_based --group_reporting --name=test~
test~: (g=0): rw=write, bs=(R) 128KiB-128KiB, (W) 128KiB-128KiB, (T) 128KiB-128KiB, ioengine=libaio, iodepth=32
fio-3.36
Starting 1 process
Jobs: 1 (f=1): [W(1)][100.0%][w=6452MiB/s][w=51.6k IOPS][eta 00m:00s]
test~: (groupid=0, jobs=1): err= 0: pid=8731: Mon Jan 13 16:01:05 2025
  write: IOPS=51.3k, BW=6409MiB/s (6720MB/s)(376GiB/60001msec); 0 zone resets
    slat (usec): min=8, max=110, avg=10.50, stdev= 2.00
    clat (usec): min=360, max=8690, avg=613.49, stdev=278.31
     lat (usec): min=373, max=8699, avg=623.98, stdev=278.33
    clat percentiles (usec):
     |  1.00th=[  578],  5.00th=[  578], 10.00th=[  578], 20.00th=[  578],
     | 30.00th=[  586], 40.00th=[  586], 50.00th=[  603], 60.00th=[  603],
     | 70.00th=[  603], 80.00th=[  603], 90.00th=[  611], 95.00th=[  619],
     | 99.00th=[  668], 99.50th=[ 1467], 99.90th=[ 5735], 99.95th=[ 5735],
     | 99.99th=[ 5800]
   bw (  MiB/s): min= 6283, max= 6482, per=100.00%, avg=6412.30, stdev=50.55, samples=119
   iops        : min=50264, max=51862, avg=51298.42, stdev=404.42, samples=119
  lat (usec)   : 500=0.07%, 750=99.14%, 1000=0.06%
  lat (msec)   : 2=0.39%, 4=0.07%, 10=0.27%
  cpu          : usr=20.63%, sys=40.69%, ctx=1562149, majf=0, minf=12
  IO depths    : 1=0.1%, 2=0.1%, 4=0.1%, 8=0.1%, 16=0.1%, 32=100.0%, >=64=0.0%
     submit    : 0=0.0%, 4=100.0%, 8=0.0%, 16=0.0%, 32=0.0%, 64=0.0%, >=64=0.0%
     complete  : 0=0.0%, 4=100.0%, 8=0.0%, 16=0.0%, 32=0.1%, 64=0.0%, >=64=0.0%
     issued rwts: total=0,3076262,0,0 short=0,0,0,0 dropped=0,0,0,0
     latency   : target=0, window=0, percentile=100.00%, depth=32

Run status group 0 (all jobs):
  WRITE: bw=6409MiB/s (6720MB/s), 6409MiB/s-6409MiB/s (6720MB/s-6720MB/s), io=376GiB (403GB), run=60001-60001msec

Disk stats (read/write):
  nvme0n1: ios=104/3071062, sectors=5232/786191872, merge=0/0, ticks=19/1874271, in_queue=1874290, util=99.89%
@meyergru please stop trying to make up excuses for the poor performance of the ms-01 in it's current state and if you have nothing else to add than "counterfeit products" please stop wasting my time as I'm really trying to solve this issue without having to send back my 4 units.
 

anewsome

Active Member
Mar 15, 2024
130
135
43
I'm not sure your benchmark is actually on the mark. It's about what I get from 3 Intel NUCs, single NVMe with 2.5Gbe networking for frontend/proxmox and dedicated 18Gbe networking on the thunderbolt in a mesh network.
Do you use jumbo frames and a dedicated switch?

Would you mind fio'ing your nvme on the host on slot 1 or 2 with
`fio --filename=/dev/nvme0n1 --ioengine=libaio --direct=1 --rw=write --bs=4k --numjobs=1 --iodepth=32 --runtime=60 --time_based --group_reporting --name=test`?
My rados bench was at around 1431MB/s but with very low IOPS, that's why I started debugging.
I've run the above rados-bench test maybe 4 or 5 times. That run was just an example. Some are better than others.

I don't have a dedicated 10gb switch, my NAS and other things are on the switch as well. I'm not using jumbo frames either. I won't run the fio test to the raw device, as these are all running workloads.

I also tried a mesh network with the thunderbolt ports and using frr for the routing. I found it plenty fast but super flaky and unreliable, powering off one node would bring down the whole network (unless the TB cable was unplugged).

I'm 100% OK with the throughput and latency of the Ceph cluster. My VMs are all super responsive, backups get done in a reasonable amount of time and things mostly just work. I'm not expecting anything more out of a 10 OSD ceph pool using consumer grade NVME ssd. I think if I want more performance, I'll need enterprise nvme ssd and more OSDs overall. Of course I won't be doing any of that since memory on these is already extremely constrained at 96GB each.
 

anewsome

Active Member
Mar 15, 2024
130
135
43
And do you have nested virtualization? I.e. can you use WSL2 from within your Win11 VM?
I found nested virtualization with Hyper-V to be really difficult to get working with MS01. I was able to find the right args for processor to get it working. I now have VMs running AzureStack HCI and Hyper-V server. I don't use any PCIe passthrough to them though. Did you ever get your nested setup with passthrough working?
 

meyergru

New Member
Jul 12, 2020
26
2
3
AFAICT, the speed has already picked up by a factor of 1000 just by using the correct parameters and still you present results based on bs=4k and sync=1. Of course these are way slower than anything you would expect. IMHO, these measurements are useless.

There is only one strange result with your Firecuda.

The difference of your ubuntu machine compared to your MS-01 proxmox host is only a factor of 2 and could be because the switch took a few minutes and the cache can have flushed to slow flash memory, thus restoring cache speeds again.

Also, there can be background noise on your proxmox host that invalidates all measurements taken there. At least there is nothing left of your initial claim:

That being said I regret having bought those units as I have a really hard time getting an acceptable speed on the NVMe.
I get around 15-45MB/s write on socket 1 and 2 even though they are running at PCIe 4.0 x4 and PCie 3.0 x4 ...
I will not discuss this any further. Good luck.
 

berkyl

New Member
Jan 13, 2025
25
3
3
I've run the above rados-bench test maybe 4 or 5 times. That run was just an example. Some are better than others.

I don't have a dedicated 10gb switch, my NAS and other things are on the switch as well. I'm not using jumbo frames either. I won't run the fio test to the raw device, as these are all running workloads.

I also tried a mesh network with the thunderbolt ports and using frr for the routing. I found it plenty fast but super flaky and unreliable, powering off one node would bring down the whole network (unless the TB cable was unplugged).

I'm 100% OK with the throughput and latency of the Ceph cluster. My VMs are all super responsive, backups get done in a reasonable amount of time and things mostly just work. I'm not expecting anything more out of a 10 OSD ceph pool using consumer grade NVME ssd. I think if I want more performance, I'll need enterprise nvme ssd and more OSDs overall. Of course I won't be doing any of that since memory on these is already extremely constrained at 96GB each.
No worries, it would have just been to figure out some similarities if there are any to get some hints to further troubleshoot.

Regarding the mesh network with TB4: you have to add an ifup at the end of the interface config to get the interface up after a reboot. If you are interested I can check out my documentation and the config on my NUCs.
 

berkyl

New Member
Jan 13, 2025
25
3
3
AFAICT, the speed has already picked up by a factor of 1000 just by using the correct parameters and still you present results based on bs=4k and sync=1. Of course these are way slower than anything you would expect. IMHO, these measurements are useless.

There is only one strange result with your Firecuda.

The difference of your ubuntu machine compared to your MS-01 proxmox host is only a factor of 2 and could be because the switch took a few minutes and the cache can have flushed to slow flash memory, thus restoring cache speeds again.

Also, there can be background noise on your proxmox host that invalidates all measurements taken there. At least there is nothing left of your initial claim:


I will not discuss this any further. Good luck.
There are a lot of strange results... but think what you want and stay in your bubble.
"is only factor 2"... and you are acting as everything is alright... sure
 
Last edited:

pimposh

hardware pimp
Nov 19, 2022
434
270
63
The KC3000 apparently does not even have a RAM cache
I might be wrong on that but i think 1/2TB got 1GB and 4TB got 2GB of DRAM. Once DRAM buffer is depleted KC3000 are known to have writes capped around 3GB/s (of course not for all kind of writes)
 

berkyl

New Member
Jan 13, 2025
25
3
3
I might be wrong on that but i think 1/2TB got 1GB and 4TB got 2GB of DRAM. Once DRAM buffer is depleted KC3000 are known to have writes capped around 3GB/s (of course not for all kind of writes)
It has, according to Kingston the DRAM is Kingston P04919900E, DDR4, 1 GB DRAM per TB capacity.
 
  • Like
Reactions: pimposh

kevin771

New Member
Oct 28, 2024
5
1
1
@berkyl, from your post yesterday, I ran the following commands on my MS-A1. I had the MS-01, but returned it because it seemed unstable. My MS-A1 has not crashed on me since I got it, 42 days ago.

I have the Kingston NVMe drive that came with the system, but also added a Western Digital Blue. That is where I have an Ubuntu VM running on which I performed the test.

Bash:
sudo fio --filename=/home/kevin/fio.bin --ioengine=libaio --direct=1 --sync=1 --rw=write --bs=4k --numjobs=1 --iodepth=32 --runtime=20 --size=10000000000 --time_based --group_reporting --name=test

test: (g=0): rw=write, bs=(R) 4096B-4096B, (W) 4096B-4096B, (T) 4096B-4096B, ioengine=libaio, iodepth=32
fio-3.36
Starting 1 process
Jobs: 1 (f=1): [W(1)][100.0%][w=72.3MiB/s][w=18.5k IOPS][eta 00m:00s]
test: (groupid=0, jobs=1): err= 0: pid=6953: Wed Jan 15 12:35:10 2025
  write: IOPS=20.7k, BW=80.7MiB/s (84.7MB/s)(1615MiB/20002msec); 0 zone resets
    slat (usec): min=2, max=2898, avg= 5.10, stdev=13.21
    clat (usec): min=402, max=31287, avg=1542.57, stdev=539.29
     lat (usec): min=405, max=31368, avg=1547.67, stdev=540.42
    clat percentiles (usec):
     |  1.00th=[  824],  5.00th=[ 1057], 10.00th=[ 1139], 20.00th=[ 1221],
     | 30.00th=[ 1287], 40.00th=[ 1401], 50.00th=[ 1565], 60.00th=[ 1663],
     | 70.00th=[ 1729], 80.00th=[ 1795], 90.00th=[ 1909], 95.00th=[ 2024],
     | 99.00th=[ 2409], 99.50th=[ 3458], 99.90th=[ 5669], 99.95th=[ 6194],
     | 99.99th=[31065]
   bw (  KiB/s): min=71520, max=95800, per=100.00%, avg=82977.03, stdev=5247.37, samples=39
   iops        : min=17880, max=23950, avg=20744.26, stdev=1311.84, samples=39
  lat (usec)   : 500=0.03%, 750=0.68%, 1000=2.34%
  lat (msec)   : 2=91.03%, 4=5.57%, 10=0.33%, 50=0.02%
  cpu          : usr=2.00%, sys=9.79%, ctx=48165, majf=0, minf=13
  IO depths    : 1=0.1%, 2=0.1%, 4=0.1%, 8=0.1%, 16=0.1%, 32=100.0%, >=64=0.0%
     submit    : 0=0.0%, 4=100.0%, 8=0.0%, 16=0.0%, 32=0.0%, 64=0.0%, >=64=0.0%
     complete  : 0=0.0%, 4=100.0%, 8=0.0%, 16=0.0%, 32=0.1%, 64=0.0%, >=64=0.0%
     issued rwts: total=0,413472,0,0 short=0,0,0,0 dropped=0,0,0,0
     latency   : target=0, window=0, percentile=100.00%, depth=32

Run status group 0 (all jobs):
  WRITE: bw=80.7MiB/s (84.7MB/s), 80.7MiB/s-80.7MiB/s (84.7MB/s-84.7MB/s), io=1615MiB (1694MB), run=20002-20002msec

Disk stats (read/write):
  sda: ios=0/571664, sectors=0/3780192, merge=0/22123, ticks=0/143258, in_queue=163892, util=79.96%
And your second command, without sync:
Bash:
sudo fio --filename=/home/kevin/fio.bin --ioengine=libaio --direct=1 --rw=write --bs=128k --numjobs=1 --iodepth=32 --runtime=20 --size=10000000000 --time_based --group_reporting --name=test

test: (g=0): rw=write, bs=(R) 128KiB-128KiB, (W) 128KiB-128KiB, (T) 128KiB-128KiB, ioengine=libaio, iodepth=32
fio-3.36
Starting 1 process
test: Laying out IO file (1 file / 9536MiB)
Jobs: 1 (f=1): [W(1)][100.0%][w=4550MiB/s][w=36.4k IOPS][eta 00m:00s]
test: (groupid=0, jobs=1): err= 0: pid=7061: Wed Jan 15 12:42:33 2025
  write: IOPS=35.9k, BW=4487MiB/s (4705MB/s)(87.7GiB/20002msec); 0 zone resets
    slat (usec): min=3, max=1261, avg= 8.97, stdev= 6.71
    clat (usec): min=149, max=30080, avg=881.60, stdev=300.98
     lat (usec): min=154, max=30086, avg=890.56, stdev=300.77
    clat percentiles (usec):
     |  1.00th=[  709],  5.00th=[  758], 10.00th=[  775], 20.00th=[  791],
     | 30.00th=[  807], 40.00th=[  816], 50.00th=[  824], 60.00th=[  832],
     | 70.00th=[  857], 80.00th=[  889], 90.00th=[ 1029], 95.00th=[ 1188],
     | 99.00th=[ 1827], 99.50th=[ 2278], 99.90th=[ 3359], 99.95th=[ 4146],
     | 99.99th=[ 5800]
   bw (  MiB/s): min= 4063, max= 4595, per=100.00%, avg=4488.92, stdev=129.75, samples=39
   iops        : min=32506, max=36764, avg=35911.36, stdev=1037.98, samples=39
  lat (usec)   : 250=0.03%, 500=0.16%, 750=3.55%, 1000=84.47%
  lat (msec)   : 2=11.03%, 4=0.70%, 10=0.05%, 50=0.01%
  cpu          : usr=12.52%, sys=36.05%, ctx=270324, majf=0, minf=13
  IO depths    : 1=0.1%, 2=0.1%, 4=0.1%, 8=0.1%, 16=0.1%, 32=100.0%, >=64=0.0%
     submit    : 0=0.0%, 4=100.0%, 8=0.0%, 16=0.0%, 32=0.0%, 64=0.0%, >=64=0.0%
     complete  : 0=0.0%, 4=100.0%, 8=0.0%, 16=0.0%, 32=0.1%, 64=0.0%, >=64=0.0%
     issued rwts: total=0,718041,0,0 short=0,0,0,0 dropped=0,0,0,0
     latency   : target=0, window=0, percentile=100.00%, depth=32

Run status group 0 (all jobs):
  WRITE: bw=4487MiB/s (4705MB/s), 4487MiB/s-4487MiB/s (4705MB/s-4705MB/s), io=87.7GiB (94.1GB), run=20002-20002msec

Disk stats (read/write):
  sda: ios=0/713944, sectors=0/182746880, merge=0/246, ticks=0/600982, in_queue=600992, util=76.21%

Note, I'm running this on the same drive that the VM operating system is installed on. It is not a raw, unformatted drive or anything. Hence, I am specifying an actual file name, and I have to specify a size.

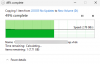
For what it is worth, when I just copy a large file using the host operating system, I get over 2GB/s:
1736970854763.png

If you'd like me to try and run any other commands or comparisons, let me know.
 
  • Like
Reactions: berkyl

berkyl

New Member
Jan 13, 2025
25
3
3
@kevin771 Thank you for providing benchmarks, you gave me hope in finding a solution for my units.

Today I found out that installing Windows on an updated BIOS 1.26 is the key. I don't know what happens during the setup but it looks like there are some flags being set resulting in sync'd write increasing 5 times and unsync'd doubling.

The values are almost near the results shown in CrystalDiskMark on Windows using Proxmox with Kernel 6.11 and I really hope those values persist.
 

berkyl

New Member
Jan 13, 2025
25
3
3
@anewsome
Regarding rados bench I now get following results without any tuning with 1M BS `rados bench -p cpool1 60 write -b 1M`:
Bash:
Total time run:         60.0119
Total writes made:      92144
Write size:             1048576
Object size:            1048576
Bandwidth (MB/sec):     1535.43
Stddev Bandwidth:       24.8844
Max bandwidth (MB/sec): 1606
Min bandwidth (MB/sec): 1488
Average IOPS:           1535
Stddev IOPS:            24.8844
Max IOPS:               1606
Min IOPS:               1488
Average Latency(s):     0.0104181
Stddev Latency(s):      0.00644595
Max latency(s):         0.0428741
Min latency(s):         0.00217387
Cleaning up (deleting benchmark objects)
Removed 92144 objects
Clean up completed and total clean up time :8.60546
As you can see I get a steady ~1.5GB/s and about tripled the IOPS without much variation.

For 4K Blocksize the IOPS are now FIFTEEN times higher `rados bench -p cpool1 60 write -b 4K`:

Bash:
Total time run:         60.0021
Total writes made:      451516
Write size:             4096
Object size:            4096
Bandwidth (MB/sec):     29.3946
Stddev Bandwidth:       0.399633
Max bandwidth (MB/sec): 30.0195
Min bandwidth (MB/sec): 28.2539
Average IOPS:           7525
Stddev IOPS:            102.306
Max IOPS:               7685
Min IOPS:               7233
Average Latency(s):     0.00212551
Stddev Latency(s):      0.000454698
Max latency(s):         0.0162819
Min latency(s):         0.00116762
Cleaning up (deleting benchmark objects)
Removed 451516 objects
Clean up completed and total clean up time :41.5871
 
  • Like
Reactions: anewsome

renewgeorgia

New Member
Oct 19, 2024
4
0
1
I am considering getting this and using it as my main Pc but also as a router.... concerned about if it can handle double duty? Any security issues doing both?

If I have it as a router and a main work PC, any suggestions on how to set up?
 

dioda

New Member
Jan 19, 2022
4
2
3
I have a similar setup, without the 25Gbe adapter. I have

  • 5x MS01
  • Same memory
  • 15x Crucial T500 2TB (3 per node)
  • Also running Proxmox
  • Also running Ceph (using 10 OSDs, 2 NVME drives per node)
  • The slowest NVME slot is used for booting each node
Ceph is configured with dedicated 10gb nic for frontend and the other 10gb nic is for Ceph backend. All in all I think it's a very similar setup to what you have. The performance I get is about right on the mark with what I'd expect from consumer drives. Note that consumer drives perform nicely until the cache is filled, and then performance falls dramatically. To avoid the falloff, you'll need enterprise NVME drives. You can see this in my rados-bench chart:

View attachment 41306
I don't recommend ceph on consumer ssd, it will quickly write to death, just the existence of 0.3DWPD write load for ssd's. Be careful with it :)
 

berkyl

New Member
Jan 13, 2025
25
3
3
I am considering getting this and using it as my main Pc but also as a router.... concerned about if it can handle double duty? Any security issues doing both?

If I have it as a router and a main work PC, any suggestions on how to set up?
It can handle this for sure, but why install both on the same system? It's not a matter of system performance to not do it; There's a high chance you'll create security holes en masse.

Why not use a cheap n100 system from Aliexpress (check out the reviews from Patrick) as a router/firewall with pfsense/opnsense and use the ms01 as work PC?
 

aliasxneo

New Member
Aug 4, 2018
9
1
3
Hi all,

Does anyone have experience using the i5 variant? My biggest concern is thermals/noise. I would like to put three into a Proxmox cluster and primarily run k8s on top of that. I don't plan to run heavy loads; maybe a small game server is the heaviest.

Everything I'm reading about thermals/noise tend to be talking about the i9. Wondering if the i5 variant fares any better in this regard?
 

Amari

New Member
Nov 13, 2025
1
0
1
Hi there,
I just bought an MS-01 with the 12900H CPU and wondering about the package C-States. Is anybody here who achieved higher states than C3? Wondering if it is a BIOS setting I set wrong or due to the 10G NIC or maybe my used nvme (WD 850x).

My idle consumption with Proxmox installed and no active vms is currently at 12 - 17 watts, most of the time at 13 watts. It's not bad but want to make sure I achieve the maximum possible on this platform.

Hi all,

Does anyone have experience using the i5 variant? My biggest concern is thermals/noise. I would like to put three into a Proxmox cluster and primarily run k8s on top of that. I don't plan to run heavy loads; maybe a small game server is the heaviest.

Everything I'm reading about thermals/noise tend to be talking about the i9. Wondering if the i5 variant fares any better in this regard?
I had it for a short period before I returned it for the bigger model. But I didn't compare temperatures. I think it depends mostly on how busy your system is overall. After replacing the thermal paste, my 12900H is at 30 C Degree idle and 75 C Degree under load. That is totally fine for me. But I have just one nvme installed and no pcie. Might get hotter if you occupy all the free slots.
 

PadPoet

New Member
Dec 24, 2025
3
0
1
Does anyone know what's the thermal pad thickness on the VRMs on the CPU heatsink on the MS-01?
 

LDighera

New Member
Feb 4, 2024
28
3
3
Santa Barbara, CA
Subject: Gemma 31B on a Minisforum MS-01 with RTX 4000 SFF Ada: what actually helped

I spent a few days trying to turn a small workstation/homelab box into a useful local LLM host. The end result is not "this replaces cloud/frontier models." It does not. But the tuning results were concrete enough that they may be useful to others trying to run local GGUF models on 20 GB class NVIDIA cards.

The short version:

- The useful win was increasing GPU layer offload after moving display ownership off the NVIDIA card.
- The best safe 31B default on this machine moved from -ngl 48 to -ngl 54.
- Decode improved from about 7.47 tok/s to about 8.81 tok/s.
- Long prompt prefill improved from about 44-45 seconds to about 37-39 seconds on a 14.5k token synthetic prompt.
- More aggressive batch/microbatch and checkpoint settings help specific workloads, but I would keep them as manual profiles, not defaults.
- A 20 GB card can run a usable local 31B model, but it still does not feel like a strong remote coding model.


Hardware
========

Host:
- Minisforum MS-01 class system
- CPU: Intel Core i9-12900H
- 20 logical CPUs
- RAM: 96 GB installed, about 93 GiB visible
- GPU: NVIDIA RTX 4000 SFF Ada Generation, 20 GB VRAM
- iGPU: Intel Alder Lake-P integrated graphics
- OS: Debian 12 with backported 6.12 kernel
- Kernel during tests: 6.12.74+deb12-amd64
- NVIDIA driver observed during tests: 535.261.03, CUDA 12.2 reported by nvidia-smi

The NVIDIA card is an RTX 4000 SFF Ada, not an A4000. It is a compact workstation card with 20 GB VRAM and modest power draw. That makes it attractive for a small box, but the 20 GB VRAM ceiling is very real for local LLMs.


Software stack
==============

Runtime:
- llama.cpp
- CUDA backend
- OpenAI-compatible llama-server

Primary text model:
- Gemma 4 31B instruct GGUF
- Quant: Q4_K_M
- Context: 16384
- KV cache: q8_0 / q8_0
- Reasoning disabled
- One parallel slot

Secondary service:
- Gemma 4 E4B multimodal GGUF Q8_0
- Used as a local image classification / OCR triage backend
- This is separate from the 31B tuning described below


Why the iGPU mattered
=====================

Initially the NVIDIA card was also carrying desktop/display duties. After enabling the Intel iGPU and forcing Xorg/SDDM onto Intel graphics, NVIDIA memory dropped to essentially idle when no model was running.

That reclaimed enough VRAM headroom to make a higher 31B offload setting viable.

This was not free. It cost some display convenience, including dual-monitor capability in the current setup. That tradeoff matters. If the machine is primarily a daily desktop, the display loss may not be worth the LLM gain. If it is primarily an inference box, it was worth testing.


Benchmark shape
===============

These are not broad benchmarks. They are controlled, practical measurements against one local deployment.

The main benchmark used synthetic text-only chat prompts calibrated to about 14.5k tokens.

Two prompt layouts were used:

1. Stable-prefix pair
- Same long prefix
- Short changed suffix
- This measures normal prompt-cache reuse when the large unchanged material is at the front.

2. Middle-mutation pair
- Same beginning and same tail
- Small changed text in the middle
- This is a harder case for normal prefix caching.

Responses were capped very short. The benchmark is mostly about prefill/cache behavior, not answer quality.

A separate short-prompt decode test generated 256 tokens to estimate decode throughput.


Starting baseline
=================

The working 31B baseline before the final tuning pass was:

-c 16384
-ngl 48
-np 1
--threads 12
--threads-batch 16
--cache-type-k q8_0
--cache-type-v q8_0
--cache-ram 32768
--fit off
--reasoning off

At -ngl 48, the 31B server used about 15.9 GiB VRAM.

Measured at -ngl 48:

Stable prefix cold: 43.9s
Stable prefix reuse: 1.85s
Middle mutation cold: 45.3s
Middle mutation reuse: 45.0s
Decode average: 7.47 tok/s

The stable-prefix result is important: llama.cpp's normal prompt cache was already very effective when the prompt shape was cache-friendly.


GPU layer offload sweep: the real win
=====================================

After freeing the NVIDIA card from display use, I swept higher -ngl values.

Load results:

-ngl 49: healthy, 16170 MiB used, 2711 MiB free
-ngl 50: healthy, 16526 MiB used, 2355 MiB free
-ngl 51: healthy, 16796 MiB used, 2085 MiB free
-ngl 52: healthy, 17100 MiB used, 1781 MiB free
-ngl 53: healthy, 17370 MiB used, 1511 MiB free
-ngl 54: healthy, 17640 MiB used, 1241 MiB free
-ngl 55: healthy, 17942 MiB used, 939 MiB free
-ngl 56: healthy, 18326 MiB used, 555 MiB free
-ngl 57: healthy, 18630 MiB used, 251 MiB free
-ngl 58: failed during CUDA compute-buffer allocation

The -ngl 58 failure was:

ggml_backend_cuda_buffer_type_alloc_buffer:
allocating 522.50 MiB on device 0: cudaMalloc failed: out of memory
graph_reserve: failed to allocate compute buffers

I treated 1 GiB free as the practical floor for a default. That made -ngl 54 the highest comfortable setting. The higher values load, but the margin is too small for a service I expect to restart reliably.

Comparison:

Setting Stable cold Stable reuse Middle cold Middle reuse Decode
-ngl 48 43.9s 1.85s 45.3s 45.0s 7.47 tok/s
-ngl 54 37.0s 1.35s 38.5s 38.2s 8.81 tok/s

This is the one change I promoted to the launcher default.

Current safe default:

-c 16384
-ngl 54
-np 1
--threads 12
--threads-batch 16
--cache-type-k q8_0
--cache-type-v q8_0
--cache-ram 32768
--fit off
--reasoning off


SWA / cache-reuse experiment
============================

I also tested:

--swa-full --cache-reuse 256

This was not a default-worthy result.

At the normal -ngl 48 shape, adding full SWA failed before health:

llama_kv_cache_iswa: using full-size SWA cache
ggml_backend_cuda_buffer_type_alloc_buffer:
allocating 5304.00 MiB on device 0: cudaMalloc failed: out of memory

To make it fit, I had to reduce offload to -ngl 40.

At -ngl 40:

Setting Stable cold Stable reuse Middle cold Middle reuse
baseline -ngl 40 53.8s 2.47s 55.0s 54.5s
-ngl 40 + SWA/cache-reuse 63.3s 2.36s 66.8s 37.4s

So yes, it helped the middle-mutation retry case. But it slowed cold passes and required giving up GPU offload. I would not use it as the general default on this hardware.


Batch and microbatch sweep
==========================

With -ngl 54 fixed, I tested larger batch settings.

Baseline upstream behavior is effectively:

--batch-size 2048
--ubatch-size 512

Results:

Batch/ubatch Stable cold Stable reuse Middle cold Middle reuse Default-safe
2048/512 37.0s 1.35s 38.5s 38.2s yes
4096/512 36.9s 1.35s 38.5s 38.1s yes, no real gain
4096/1024 32.1s 1.40s 33.6s 18.1s no, too tight
8192/1024 31.9s 1.41s 33.5s 17.9s no, too tight

The ubatch 1024 cases are interesting. They accelerate prefill and make the middle-mutation retry much faster. But the memory margin is poor.

For 8192/1024, the stopped-server memory breakdown showed CUDA free memory down to about 247 MiB, with compute buffers around 1045 MiB.

That is too tight for an everyday default. I kept it as a manual high-throughput profile:

--batch-size 8192 --ubatch-size 1024


Context checkpoint spacing
==========================

The ubatch 1024 result suggested that context checkpoint behavior might be part of the middle-mutation improvement, so I tested checkpoint spacing with default batch settings.

Default upstream checkpoint interval is 8192 tokens.

Results:

Checkpoint interval Stable cold Stable reuse Middle cold Middle reuse
default 8192 37.0s 1.35s 38.5s 38.2s
4096 37.1s 1.34s 38.8s 28.6s
2048 37.9s 1.34s 39.7s 23.8s
1024 38.1s 1.35s 40.0s 24.0s

The 2048 interval was best for middle-mutation retry. It did not increase resident VRAM the way ubatch 1024 did, and the stopped-server memory breakdown still showed about 953 MiB CUDA free memory.

The cost is slower cold prompts and larger prompt-cache state. At 2048, the server reported 8 checkpoints and about 6329 MiB cache state for one 14.5k-token prompt.

I kept the default checkpoint interval unchanged, but added this as a manual profile:

--checkpoint-every-n-tokens 2048

For a balanced manual option:

--checkpoint-every-n-tokens 4096


Cache RAM
=========

I also tested increasing cache RAM from 32768 MiB to 65536 MiB before this final tuning pass. It did not produce a meaningful speed gain on the repeated long-prefix test.

Measured earlier:

cache-ram 32768: about 58.8s cold, 12.0s cached
cache-ram 65536: about 59.8s cold, 12.1s cached

The conclusion was simple: 32768 MiB was already enough for the tested single cached prefix. More cache RAM used system RAM but did not make that workload faster.


What I would keep
=================

Safe default:

-c 16384
-ngl 54
--threads 12
--threads-batch 16
--cache-type-k q8_0
--cache-type-v q8_0
--cache-ram 32768
--fit off
--reasoning off

Manual high-throughput profile, if tight VRAM margin is acceptable:

--batch-size 8192 --ubatch-size 1024

Manual middle-mutation profile:

--checkpoint-every-n-tokens 2048

Experimental only:

-ngl 55 through -ngl 57
--swa-full --cache-reuse 256

Do not bother without another memory-saving change:

-ngl 58


Operational notes
=================

A few practical lessons from this run:

1. 20 GB VRAM is the ceiling.

The system has 96 GB RAM and 20 CPU threads. That helps with loading, caching, and running hybrid configurations, but it does not turn a dense 31B model into a fast local coding assistant. GPU memory bandwidth and VRAM capacity dominate.

2. Moving display off NVIDIA can matter.

Moving Xorg/SDDM to the Intel iGPU gave the RTX 4000 SFF Ada a clean compute role and made -ngl 54 viable. But this had user-experience cost. In my case, it affected dual-monitor behavior. Whether that is worth it depends on whether the box is a workstation or an inference appliance.

3. Prompt shape matters more than some exotic flags.

Stable-prefix caching was already excellent. If the large stable material is before the changing query, cache reuse is strong. Middle edits are much harder unless you use checkpoint or batch profiles tuned for that workload.

4. The "loads successfully" line is not enough.

-ngl 57 loaded, but left only about 251 MiB free. That is not a healthy default. You need enough margin for compute buffers, fragmentation, restarts, and slightly different prompt shapes.

5. This is usable, not magical.

The final safe profile gives about 8.8 tok/s decode on this setup. That is useful for local/private/offline work. It is not competitive with strong hosted models for serious coding throughput.


Final take
==========

The good news: this MS-01 plus RTX 4000 SFF Ada can run a useful local 31B GGUF model, and there are real tuning gains a vailable. The best general gain was not an exotic trick; it was reclaiming VRAM and increasing layer offload from -ngl 48 to -ngl 54.

The bad news: the machine still does not become a frontier-class local coding box. The hardware is good enough for a local lab model, classifier sidecars, privacy-sensitive work, and experiments. It is not enough to make a 31B dense model feel like a modern hosted coding model.

If I were building around this class of hardware again, I would treat 20 GB Ada as a very capable edge/homelab inference card, not as a substitute for a larger VRAM GPU when the goal is comfortable local LLM coding.

Corrections and suggestions welcome. I would be especially interested in comparable llama.cpp numbers from other 20 GB cards, RTX 3090/4090 class cards, and anyone running similar long-prompt cache tests with Gemma-family GGUFs.