PS ... I of course took screenshots of the results after doing the FIO test yesterday as well as reading and writing some media to the array to record those CPU results, etc (bc I could easily have overlooked something -- I am a retard sometimes) ... would you guys like me to upload the pictures of each of the statistics on TN scale..?
What kind of R/W perf can I hope for with 4x NVMe drives over SFP28 using TrueNAS..?
- Thread starter TrumanHW
- Start date
Notice: Page may contain affiliate links for which we may earn a small commission through services like Amazon Affiliates or Skimlinks.
Well, things still make no sense, but I've at least ruled some things out:
Ubuntu's (built-in) benchmark: All drives get ≥3.3GBs R & W
Got some weird behavior trying to install Core (skipping to avoid confusing / making anyone read too much).
Successfully installed & booted into Core
I have no confidence in reading the FIO perf & would appreciate some interpretive dance.")
That said, I sure think it Writes faster than UNDER 1MBs
(as it shows happened only ONCE in the performance info of Core).
Core's stats show only one peak of less than 1MBs (717.86 KiB/s )
Which is total bullshit ... and nothing like the 3+ GBs I get on EACH drive in Ubuntu.
Even ignoring my inability to read (decode) the FIO output ...
FIO is a local test (no network involvement: In principle, the same as in Ubuntu).
I absolutely know I ran about 8 FIO tests ... yet, ZFS shows only ONE peak on the graph.
At that ... the one time it shows a speed for is still slower than the speed FIO says (I think).
WTF is going on ..?
I'm attaching pictures not bc I didn't say things that correspond to them...but bc I'd understand anyone thinking I'm completely retarded (I often am) and agree that you shouldn't trust.


Ubuntu's (built-in) benchmark: All drives get ≥3.3GBs R & W
Got some weird behavior trying to install Core (skipping to avoid confusing / making anyone read too much).
Successfully installed & booted into Core
I have no confidence in reading the FIO perf & would appreciate some interpretive dance.
That said, I sure think it Writes faster than UNDER 1MBs
(as it shows happened only ONCE in the performance info of Core).
Core's stats show only one peak of less than 1MBs (717.86 KiB/s )
Which is total bullshit ... and nothing like the 3+ GBs I get on EACH drive in Ubuntu.
Even ignoring my inability to read (decode) the FIO output ...
FIO is a local test (no network involvement: In principle, the same as in Ubuntu).
I absolutely know I ran about 8 FIO tests ... yet, ZFS shows only ONE peak on the graph.
At that ... the one time it shows a speed for is still slower than the speed FIO says (I think).
WTF is going on ..?
I'm attaching pictures not bc I didn't say things that correspond to them...but bc I'd understand anyone thinking I'm completely retarded (I often am) and agree that you shouldn't trust.
Code:
root@truenas[~]# fio --filename=/fiotest --rw=write --bs=1024Mi --rwmixread=30 -
-iodepth=10 --numjobs=5 --runtime=90s --name=1024ktest --size=10G
1024ktest: (g=0): rw=write, bs=(R) 1024MiB-1024MiB, (W) 1024MiB-1024MiB, (T) 102
4MiB-1024MiB, ioengine=psync, iodepth=10
...
fio-3.28
Starting 5 processes
1024ktest: Laying out IO file (1 file / 10240MiB)
1024ktest: Laying out IO file (1 file / 10240MiB)1024ktest: Laying out IO file (1 file / 10240MiB)
1024ktest: Laying out IO file (1 file / 10240MiB)
1024ktest: Laying out IO file (1 file / 10240MiB)
Jobs: 2 (f=0): [E(1),f(1),E(1),f(1),E(1)][100.0%][w=3835MiB/s][w=3 IOPS][eta 00m
:00s]
1024ktest: (groupid=0, jobs=1): err= 0: pid=4130: Sun Jun 11 16:18:01 2023
  write: IOPS=0, BW=66.8MiB/s (70.0MB/s)(6144MiB/91994msec); 0 zone resets
    clat (msec): min=468, max=59598, avg=15292.00, stdev=22232.07
     lat (msec): min=501, max=59635, avg=15332.26, stdev=22231.64
    clat percentiles (msec):
     |  1.00th=[  468],  5.00th=[  468], 10.00th=[  468], 20.00th=[  743],
     | 30.00th=[  743], 40.00th=[ 9060], 50.00th=[ 9060], 60.00th=[10939],     | 70.00th=[10939], 80.00th=[10939], 90.00th=[17113], 95.00th=[17113],
     | 99.00th=[17113], 99.50th=[17113], 99.90th=[17113], 99.95th=[17113],     | 99.99th=[17113]
   bw (  MiB/s): min= 1984, max= 2043, per=100.00%, avg=2026.40, stdev=26.41, samples=5
   iops        : min=    1, max=    1, avg= 1.00, stdev= 0.00, samples=5
  lat (msec)   : 500=16.67%, 750=16.67%, >=2000=66.67%
  cpu          : usr=0.33%, sys=1.57%, ctx=32763, majf=0, minf=0
  IO depths    : 1=100.0%, 2=0.0%, 4=0.0%, 8=0.0%, 16=0.0%, 32=0.0%, >=64=0.0%
     submit    : 0=0.0%, 4=100.0%, 8=0.0%, 16=0.0%, 32=0.0%, 64=0.0%, >=64=0.0%
     complete  : 0=0.0%, 4=100.0%, 8=0.0%, 16=0.0%, 32=0.0%, 64=0.0%, >=64=0.0%
     issued rwts: total=0,6,0,0 short=0,0,0,0 dropped=0,0,0,0
     latency   : target=0, window=0, percentile=100.00%, depth=10
1024ktest: (groupid=0, jobs=1): err= 0: pid=4131: Sun Jun 11 16:18:01 2023
  write: IOPS=0, BW=34.1MiB/s (35.7MB/s)(3072MiB/90125msec); 0 zone resets
    clat (msec): min=10971, max=58440, avg=29115.17, stdev=25633.91
     lat (msec): min=11007, max=58478, avg=29153.00, stdev=25633.93
    clat percentiles (msec):
     |  1.00th=[10939],  5.00th=[10939], 10.00th=[10939], 20.00th=[10939],
     | 30.00th=[10939], 40.00th=[17113], 50.00th=[17113], 60.00th=[17113],
     | 70.00th=[17113], 80.00th=[17113], 90.00th=[17113], 95.00th=[17113],
     | 99.00th=[17113], 99.50th=[17113], 99.90th=[17113], 99.95th=[17113],
     | 99.99th=[17113]
   bw (  MiB/s): min= 1984, max= 2043, per=100.00%, avg=2014.20, stdev=42.01, samples=2
   iops        : min=    1, max=    1, avg= 1.00, stdev= 0.00, samples=2
  lat (msec)   : >=2000=100.00%
  cpu          : usr=0.13%, sys=0.79%, ctx=24586, majf=0, minf=0
  IO depths    : 1=100.0%, 2=0.0%, 4=0.0%, 8=0.0%, 16=0.0%, 32=0.0%, >=64=0.0%
     submit    : 0=0.0%, 4=100.0%, 8=0.0%, 16=0.0%, 32=0.0%, 64=0.0%, >=64=0.0%
     complete  : 0=0.0%, 4=100.0%, 8=0.0%, 16=0.0%, 32=0.0%, 64=0.0%, >=64=0.0%
     issued rwts: total=0,3,0,0 short=0,0,0,0 dropped=0,0,0,0
     latency   : target=0, window=0, percentile=100.00%, depth=10
1024ktest: (groupid=0, jobs=1): err= 0: pid=4132: Sun Jun 11 16:18:01 2023
  write: IOPS=0, BW=77.9MiB/s (81.7MB/s)(7168MiB/92048msec); 0 zone resets
    clat (msec): min=237, max=59643, avg=13113.09, stdev=21011.78
     lat (msec): min=265, max=59687, avg=13149.67, stdev=21015.19
    clat percentiles (msec):
     |  1.00th=[  239],  5.00th=[  239], 10.00th=[  239], 20.00th=[  768],
     | 30.00th=[ 2165], 40.00th=[ 2165], 50.00th=[ 7080], 60.00th=[10939],
     | 70.00th=[10939], 80.00th=[10939], 90.00th=[17113], 95.00th=[17113],
     | 99.00th=[17113], 99.50th=[17113], 99.90th=[17113], 99.95th=[17113],
     | 99.99th=[17113]
   bw (  MiB/s): min= 1984, max= 2048, per=100.00%, avg=2026.61, stdev=23.49, samples=6
   iops        : min=    1, max=    2, avg= 1.17, stdev= 0.41, samples=6
  lat (msec)   : 250=14.29%, 1000=14.29%, >=2000=71.43%
  cpu          : usr=0.32%, sys=1.84%, ctx=34698, majf=0, minf=0
  IO depths    : 1=100.0%, 2=0.0%, 4=0.0%, 8=0.0%, 16=0.0%, 32=0.0%, >=64=0.0%
     submit    : 0=0.0%, 4=100.0%, 8=0.0%, 16=0.0%, 32=0.0%, 64=0.0%, >=64=0.0%
     complete  : 0=0.0%, 4=100.0%, 8=0.0%, 16=0.0%, 32=0.0%, 64=0.0%, >=64=0.0%
     issued rwts: total=0,7,0,0 short=0,0,0,0 dropped=0,0,0,0
     latency   : target=0, window=0, percentile=100.00%, depth=10
1024ktest: (groupid=0, jobs=1): err= 0: pid=4133: Sun Jun 11 16:18:01 2023
  write: IOPS=0, BW=44.8MiB/s (46.9MB/s)(4096MiB/91495msec); 0 zone resets
    clat (msec): min=9018, max=59690, avg=22656.52, stdev=24706.26
     lat (msec): min=9054, max=59738, avg=22699.64, stdev=24709.50
    clat percentiles (msec):
     |  1.00th=[ 9060],  5.00th=[ 9060], 10.00th=[ 9060], 20.00th=[ 9060],
     | 30.00th=[10939], 40.00th=[10939], 50.00th=[10939], 60.00th=[10939],
     | 70.00th=[10939], 80.00th=[17113], 90.00th=[17113], 95.00th=[17113],
     | 99.00th=[17113], 99.50th=[17113], 99.90th=[17113], 99.95th=[17113],
     | 99.99th=[17113]
   bw (  MiB/s): min= 1984, max= 2043, per=100.00%, avg=2024.11, stdev=34.30, samples=3
   iops        : min=    1, max=    1, avg= 1.00, stdev= 0.00, samples=3
  lat (msec)   : >=2000=100.00%
  cpu          : usr=0.17%, sys=1.13%, ctx=32751, majf=0, minf=0
  IO depths    : 1=100.0%, 2=0.0%, 4=0.0%, 8=0.0%, 16=0.0%, 32=0.0%, >=64=0.0%
     submit    : 0=0.0%, 4=100.0%, 8=0.0%, 16=0.0%, 32=0.0%, 64=0.0%, >=64=0.0%
     complete  : 0=0.0%, 4=100.0%, 8=0.0%, 16=0.0%, 32=0.0%, 64=0.0%, >=64=0.0%
     issued rwts: total=0,4,0,0 short=0,0,0,0 dropped=0,0,0,0
     latency   : target=0, window=0, percentile=100.00%, depth=10
1024ktest: (groupid=0, jobs=1): err= 0: pid=4134: Sun Jun 11 16:18:01 2023
  write: IOPS=0, BW=55.6MiB/s (58.3MB/s)(5120MiB/92049msec); 0 zone resets
    clat (msec): min=742, max=59684, avg=18271.55, stdev=23531.94
     lat (msec): min=794, max=59729, avg=18317.13, stdev=23531.10
    clat percentiles (msec):
     |  1.00th=[  743],  5.00th=[  743], 10.00th=[  743], 20.00th=[  743],
     | 30.00th=[ 9060], 40.00th=[ 9060], 50.00th=[10939], 60.00th=[10939],
     | 70.00th=[10939], 80.00th=[10939], 90.00th=[17113], 95.00th=[17113],
     | 99.00th=[17113], 99.50th=[17113], 99.90th=[17113], 99.95th=[17113],
     | 99.99th=[17113]
   bw (  MiB/s): min= 1984, max= 2043, per=100.00%, avg=2018.98, stdev=25.72, samples=4
   iops        : min=    1, max=    1, avg= 1.00, stdev= 0.00, samples=4
  lat (msec)   : 750=20.00%, >=2000=80.00%
  cpu          : usr=0.23%, sys=1.35%, ctx=32747, majf=0, minf=0
  IO depths    : 1=100.0%, 2=0.0%, 4=0.0%, 8=0.0%, 16=0.0%, 32=0.0%, >=64=0.0%
     submit    : 0=0.0%, 4=100.0%, 8=0.0%, 16=0.0%, 32=0.0%, 64=0.0%, >=64=0.0%
     complete  : 0=0.0%, 4=100.0%, 8=0.0%, 16=0.0%, 32=0.0%, 64=0.0%, >=64=0.0%
     issued rwts: total=0,5,0,0 short=0,0,0,0 dropped=0,0,0,0
     latency   : target=0, window=0, percentile=100.00%, depth=10

Run status group 0 (all jobs):
  WRITE: bw=278MiB/s (292MB/s), 34.1MiB/s-77.9MiB/s (35.7MB/s-81.7MB/s), io=25.0GiB (26.8GB), run=90125-92049msec
root@truenas[~]#Great catch. Thank you. (see? i'm an idiot).U sure u write to the correct drive?
Ur filename points to the root filesystem which usually is on the boot drive. You might have forgotten the . in the path
(I didn't realize that's what the . preface was for)
Will retry when I get home.
Would you mind doing a couple of things for me..?...You might have forgotten the . in the path
1. How do I quit an FIO command..? ctrl-C doesn't work obviously.
2. Decode these FIO variables, as the variables are ambiguous in name. And the output isn't clarifying either.
Eg:
--filename=./fiotest
What is the utility of this file..? Does it just make a copy of the info shown when I run the command..?
(optional) Why doesn't it use a regular path ..? I thought the . preface was for hidden locations, no?
--rw=write
This means it's a write-test only ?
It seems like other fields would be either redundant or contradictory.
Two fields down says rwmixread=30 ... but this field says its write only.
So how does a percent ? if that's what rwmixread=30 is referring to as this says no read (all write) ..?
--bs=1024Mi
Block size obviously, but how does this work ..? As files? Or to each dev..?
--rwmixread=30
mixed read? How? It doesn't say "randw" ... what does this mean?
--iodepth=10
I don't understand this either.
Which fields does this 'depth' interact with..?
As in ... as it says "10" is that 10 x 5 jobs?
Is a job related to the last field, -- size=10G meaning 10x5 x 10G..? Or 500G ..??
--numjobs=5
What is a job exactly ..?
--runtime=90s
is this a limit of how long it can run.
How long it SHOULD run..?
What does this mean?
--name=1024ktest
I thought we already gave it a name at the beginning ... no?
--size=10G
And obviously ... what does this mean?
Last edited:
I ran the command on another TrueNAS machine of mine to see if the test and performance info are related... and again, (even with the dot) it seems like maybe it's only logging performance in ZFS if its requested from a pool...?
If those questions are too onerous to answer...
What performance does the output from my other array say..?
How much data it actually read ..?
How much was written ..?
Was any data read..?
Why does it suggest any was simultaneously read-and-written..?
And do you agree that it's not logged in ZFS "reports dashboard" ..?
The command I ran:
fio --filename=./fiotest --rw=write --bs=1024Mi --rwmixread=30 --iodepth=10 --numjobs=5 --runtime=90s --name=1024ktest --size=10G
Code:
root@FreeNAS[~]# fio --filename=./fiotest --rw=write --bs=1024Mi --rwmixread=30--iodepth=10 --numjobs=5 --runtime=90s --name=1024ktest --size=10G
1024ktest: (g=0): rw=write, bs=(R) 1024MiB-1024MiB, (W) 1024MiB-1024MiB, (T) 1024MiB-1024MiB, ioengine=psync, iodepth=10
...
fio-3.28
Starting 5 processes
1024ktest: Laying out IO file (1 file / 10240MiB)
1024ktest: Laying out IO file (1 file / 10240MiB)
1024ktest: Laying out IO file (1 file / 10240MiB)
1024ktest: Laying out IO file (1 file / 10240MiB)
1024ktest: Laying out IO file (1 file / 10240MiB)
fio: pid=20403, got signal=9[eta 01m:30s]
fio: pid=20406, got signal=9
fio: pid=20405, got signal=92),K(1)][71.6%][eta 01m:30s]
Jobs: 1 (f=0): [f(1),K(1),E(1),K(2)][100.0%][eta 00m:00s]
1024ktest: (groupid=0, jobs=1): err= 0: pid=20402: Mon Jun 12 14:27:05 2023
  write: IOPS=0, BW=23.9MiB/s (25.0MB/s)(3072MiB/128779msec); 0 zone resets
    clat (msec): min=23040, max=57811, avg=42574.50, stdev=17779.58
     lat (msec): min=23844, max=57893, avg=42902.67, stdev=17384.90
    clat percentiles (msec):
     |  1.00th=[17113],  5.00th=[17113], 10.00th=[17113], 20.00th=[17113],
     | 30.00th=[17113], 40.00th=[17113], 50.00th=[17113], 60.00th=[17113],
     | 70.00th=[17113], 80.00th=[17113], 90.00th=[17113], 95.00th=[17113],
     | 99.00th=[17113], 99.50th=[17113], 99.90th=[17113], 99.95th=[17113],
     | 99.99th=[17113]
   bw (  MiB/s): min= 2011, max= 2035, per=100.00%, avg=2023.79, stdev=16.97, samples=2
   iops        : min=    1, max=    1, avg= 1.00, stdev= 0.00, samples=2
  lat (msec)   : >=2000=100.00%
  cpu          : usr=0.26%, sys=1.67%, ctx=5808, majf=12, minf=261664
  IO depths    : 1=100.0%, 2=0.0%, 4=0.0%, 8=0.0%, 16=0.0%, 32=0.0%, >=64=0.0%
     submit    : 0=0.0%, 4=100.0%, 8=0.0%, 16=0.0%, 32=0.0%, 64=0.0%, >=64=0.0%
     complete  : 0=0.0%, 4=100.0%, 8=0.0%, 16=0.0%, 32=0.0%, 64=0.0%, >=64=0.0%
     issued rwts: total=0,3,0,0 short=0,0,0,0 dropped=0,0,0,0
     latency   : target=0, window=0, percentile=100.00%, depth=10
1024ktest: (groupid=0, jobs=1): err= 0: pid=20404: Mon Jun 12 14:27:05 2023
  write: IOPS=0, BW=15.9MiB/s (16.7MB/s)(2048MiB/128770msec); 0 zone resets
    clat (msec): min=46868, max=80929, avg=63898.91, stdev=24084.19
     lat (msec): min=46996, max=81732, avg=64364.19, stdev=24561.83
    clat percentiles (msec):
     |  1.00th=[17113],  5.00th=[17113], 10.00th=[17113], 20.00th=[17113],
     | 30.00th=[17113], 40.00th=[17113], 50.00th=[17113], 60.00th=[17113],
     | 70.00th=[17113], 80.00th=[17113], 90.00th=[17113], 95.00th=[17113],
     | 99.00th=[17113], 99.50th=[17113], 99.90th=[17113], 99.95th=[17113],
     | 99.99th=[17113]
   bw (  MiB/s): min= 2011, max= 2011, per=100.00%, avg=2011.79, stdev= 0.00, samples=1
   iops        : min=    1, max=    1, avg= 1.00, stdev= 0.00, samples=1
  lat (msec)   : >=2000=100.00%
  cpu          : usr=0.20%, sys=1.29%, ctx=50, majf=4, minf=255363
  IO depths    : 1=100.0%, 2=0.0%, 4=0.0%, 8=0.0%, 16=0.0%, 32=0.0%, >=64=0.0%
     submit    : 0=0.0%, 4=100.0%, 8=0.0%, 16=0.0%, 32=0.0%, 64=0.0%, >=64=0.0%
     complete  : 0=0.0%, 4=100.0%, 8=0.0%, 16=0.0%, 32=0.0%, 64=0.0%, >=64=0.0%
     issued rwts: total=0,2,0,0 short=0,0,0,0 dropped=0,0,0,0
     latency : target=0, window=0, percentile=100.00%, depth=10

Run status group 0 (all jobs):
     WRITE: bw=39.8MiB/s (41.7MB/s), 15.9MiB/s-23.9MiB/s (16.7MB/s-25.0MB/s), io=51 20MiB (5369MB), run= 128770-128779msec
fio: file hash not empty on exit

root@FreeNAS [ ~ 1#CTRL-C works for me?Would you mind doing a couple of things for me..?
1. How do I quit an FIO command..? ctrl-C doesn't work obviously.
man fio is your friend2. Decode these FIO variables, as the variables are ambiguous in name. And the output isn't clarifying either. Eg:
--filename=./fiotest
Thats the name of the test file you're using to perform the tests
. is the current path in *.nix, so ./ points to a file in your current location in the tree. run the command this way if you have cd'ed to your test filesystem only
--rw=write
This means it's a write-test only ? Yes
Two fields down says rwmixread=30 ... but this field says its write only. --- Fio expects you to know what you're doing. If you're doing qrite only, the rwmix has no effect
--rwmixread=30
mixed read? How? It doesn't say "randw" ... what does this mean? --- If you run a read + write test (random or not), this is the percentage of reads
--bs=1024Mi
Block size obviously, but how does this work ..? As files? Or to each dev..? --- fio read/writes from/to the destination files in blocks of size 1MB (vs 4k, 128k etc). This is used to emulate streaming access
--iodepth=10
I don't understand this either. Which fields does this 'depth' interact with..? As in ... as it says "10" is that 10 x 5 jobs?Is a job related to the last field, -- size=10G meaning 10x5 x 10G..? Or 500G ..??
-- fio will put 10 write commands in the processing queue of the target device/drive
--numjobs=5 What is a job exactly ..? - a Job is a write thread, so it will use 5 threads at the same time to read/write data
jobs x iodepth will be the total read/write load hitting your file/devices
--runtime=90s
is this a limit of how long it can run.How long it SHOULD run..?What does this mean? It will run for 90 seconds and then stop
--size=10G And obviously ... what does this mean? -- it will create a 10G test file (per Job). If used with runtime it will use the same 10G during the whole runtime. If you only have runtime it will write as much as it can in that time.
--name=1024ktest
I thought we already gave it a name at the beginning ... no? --- No. you've given a filename to use. This is the jobname
Have you run cd /mnt/<pool>/<dataset> before you ran fio? Guess not.I ran the command on another TrueNAS machine of mine to see if the test and performance info are related... and again, (even with the dot) it seems like maybe it's only logging performance in ZFS if its requested from a pool...?
Code:root@FreeNAS[~]# fio --filename=./fiotest --rw=write --bs=1024Mi --rwmixread=30--iodepth=10 --numjobs=5 --runtime=90s --name=1024ktest --size=10G
Code:
root@truenas14[~]# cd /mnt/tank6
root@truenas14[/mnt/tank6]# fio --filename=random.fio --direct=1 --rw=randrw --bs=128k --size=100G --numjobs=30 --runtime=120 --group_reporting --name=yeeetiops --rwmixread=5 --thread --ioengine=psyncIt actually doesn't work.CTRL-C works for me?
I'd found a command that did but can't remember the f-r.
AND, TrueNAS Shell History isn't comprehensive.
I'll need to just read more bc FreeBSD or TrueNAS treats some directories and shortcuts different than I'm used to.--filename=./fiotest
. is the current path in *.nix
so ./ points to a file in your current location in the tree.
run the command this way if you have cd'ed to your test filesystem only
In my little MacOS world, a file prefaced with . means it's hidden...yet I don't need to add the option -a to see them in FreeBSD as I do in MacOS' BSD.
Likewise, the home folder is ~ ... whereas TN or FreeBSD is treating 'root' as ~ ... though / is still the actual root.
If I said:--rw=write
This means it's a write-test only ? Yes
--rw=readandwrite (instead of write)
...and included the --rwmixread=30
...I'd assume it'd implicitly cause W = 70% ..?
Any way to simultaneously test R and W ..? (vs interpolating between them..?)
(I'd never bother on mechanical drives that weren't striped or mirrored, but probably will on the NVMe if they ever work right)
--size=10G
if I provide both runtime & size I assume duration will be whichever is shorter..?
In other news ... I've been trying to review the FIO file I created to learn how FIO works better ... but, when I cp it places that are accessible via the GUI, the file seems like it doesn't exist (see pictures).
I tried to copy it using the SSH command to copy from the server to local ... but it looks like it's doing things that made me worried, this is the command I used:
scp truman@10.0.184.67:/root/fiotest /Volumes/Macintosh\ HD/Users/truman/Downloads/
FWIW ...to copy a file in MacOS Shell I'd type...
cp /location/file.ext /location/
But it acted like I was logging in again and said it was unable to to copy the entire "DRIVE" !!
(needless to say I didn't try that again ... and assumed I must not understand something here).
Have you run
Code:cd /mnt/<pool>/<dataset> before you ran fio? Guess not.
OMG. Holy shit. I mean, obviously. What the F was I thinking !?
Like, I made no effort to be IN the freaking CORRECT location!
Bc it'll just magically know what I want without specifying it.
I also had tried finding & reading that report (fail).
And tried copying it to my local machine (fail; as shown above).
I owe you. You debugged some serious stupidity of mine.
Repeatedly. Like, babysitting my dumb ass. Honestly this is embarrassing.
Off to do this properly when I get home.
Ok, with the completely obvious point that I should be running the test in a location that'd write to the actual array I wanted to test!!!!
Yes ... I get more reasonable results. But they still don't make sense.
Is the reporting in TrueNAS completely worthless..?
Do I now know how to READ TN reporting !?
The pictures I'm posting are two different arrays; my old 80TB spinning array and my new 64TB NVMe array.
So getting 25MB/s -- 200MB/s on the spinning array is at least consistent with physics.
And getting a few GB per second on the NVMe array does (though, each DRIVE should get that performance).
What makes no sense ..? Is the report performance vs either of the extremes in the final line of FIO reporting.
ZFS says the spinning drives Write at 28.4 MB/s (across 8 drives)
28.4 x 8 = 227 MB/s
But FIO says it either got 1,483 MB/s or 148 MB/s.
(and FIO doesn't seem like it knows it's an array ... or what that array is comprised of.)


and...suggests a spinning array transferred 178GB in 2 min.
ONLY thing I can think of? It's capitalizing MB and GB "B" when it really means "BITS"
But guess what..? While that's closer, it's still not right! lol
But if I have to choose between ...
- ZFS having no idea what rate it transfers at...
- FIO being unable to do the one thing it does!
- Me being ignorant or confused.....?
Given all the other mistakes I've made I think humility if not modesty would be wise. But I'm still confused. wtf?
And the weird reporting continues to the NVMe array:
ZFS says the NVMe array Writes at all of 340 MiB/s (across 8 drives)
340 x 8 = 2,720 MiB/s
And FIO says it got either ... 5,381 MB/s or 557 MB/s ..! (again, as if that's a small range?)


Ranges so huge that they're somewhere between useless & contradictory ...
Yes ... I get more reasonable results. But they still don't make sense.
Is the reporting in TrueNAS completely worthless..?
Do I now know how to READ TN reporting !?
The pictures I'm posting are two different arrays; my old 80TB spinning array and my new 64TB NVMe array.
So getting 25MB/s -- 200MB/s on the spinning array is at least consistent with physics.
And getting a few GB per second on the NVMe array does (though, each DRIVE should get that performance).
What makes no sense ..? Is the report performance vs either of the extremes in the final line of FIO reporting.
ZFS says the spinning drives Write at 28.4 MB/s (across 8 drives)
28.4 x 8 = 227 MB/s
But FIO says it either got 1,483 MB/s or 148 MB/s.
(and FIO doesn't seem like it knows it's an array ... or what that array is comprised of.)
and...suggests a spinning array transferred 178GB in 2 min.
ONLY thing I can think of? It's capitalizing MB and GB "B" when it really means "BITS"
But guess what..? While that's closer, it's still not right! lol
But if I have to choose between ...
- ZFS having no idea what rate it transfers at...
- FIO being unable to do the one thing it does!
- Me being ignorant or confused.....?
Given all the other mistakes I've made I think humility if not modesty would be wise. But I'm still confused. wtf?
And the weird reporting continues to the NVMe array:
ZFS says the NVMe array Writes at all of 340 MiB/s (across 8 drives)
340 x 8 = 2,720 MiB/s
And FIO says it got either ... 5,381 MB/s or 557 MB/s ..! (again, as if that's a small range?)
Ranges so huge that they're somewhere between useless & contradictory ...
So,
first of all, ~ refers to the home path of the current user which is /root for root and would be /home/truman for user truman (defaults).
Second, a file with . in front might be hidden, but on cli this is a directory reference unless its part of a filename ... ./.test is referencing a file in the current directory with name .test which would be hidden unless u run ls -a. The other directory reference you use is .., referring to the directory above the current one
>scp truman@10.0.184.67:/root/fiotest /Volumes/Macintosh\ HD/Users/truman/Downloads/
that copies a file from 10.0.184.67 (sourcepath /root/fiotest) to the local directory "/Volumes/Macintosh\ HD/Users/truman/Downloads/". In order to do tht it usees the user truman to read the file on the remote system, asking you to provide a password - seems to be what you want?
>FWIW ...to copy a file in MacOS Shell I'd type... cp /location/file.ext /location/
Same on TNC, except ur copying from /location to /location so kinda useless
Btw - its better to ssh into TNC than using the webgui shell access (setup sshd) for running fio tests. Dont do config operations on cli though, and when creating pools u might need to import them.
Re your tests - its difficult to comment on them if you dont provide the command you run.
If you look at my output you see I get 5% read (rwmixread, there is also rwmixwrite) and 95% write. If you use randrw and dont specify a percentage then u get a 50:50 test
I get a result for Write and for Read. For me its consistent, for you its not.
Now if you (had) looked at eg 1. fio - Flexible I/O tester rev. 3.35 — fio 3.35-6-g1b4b-dirty documentation,
it would have told you that

so your total bandwidth was 5G, ~500G per thread (which is why we need the command).
On TNC the performance that you see is per device (each disk), not per pool, so you need to add those up. Bear in mind that its not only the fio test thats writing but also metadata, that some parts are getting cached first or might not be written to all disks the same depending on pool layout. In my case (peak) perf per disk (5 disk z1 pool) was 283MB/s but it was not at that speed the hole 120s, so total perf per disk was lower.
But yes, TNC reporting is crap, if i run real test i tend to send that out to Grafana (via graphite plugin for node exporter). One thing missing from the perl script sadly, direct tsdb integration.
Anyhow, looking at your output without the command is difficult, its hard to say why ur per thread result is only 10% of total unless u ran 10 threads?
Also this is the point where to pool design and the relationship of test jobs to read/write #of vdevs begins to matter.
Ideally you should start simple, maybe by pointing fio to a raw device (filename = /dev/nvd0) or a single mirror to establish a baseline (or in your case verify the device is working even remotely as expected in TNC).
Cheers
first of all, ~ refers to the home path of the current user which is /root for root and would be /home/truman for user truman (defaults).
Code:
root@truenas14[~]# pwd
/root
root@truenas14[~]# cd /
root@truenas14[/]# pwd
/
root@truenas14[/]# cd ~
root@truenas14[~]# pwd
/root>scp truman@10.0.184.67:/root/fiotest /Volumes/Macintosh\ HD/Users/truman/Downloads/
that copies a file from 10.0.184.67 (sourcepath /root/fiotest) to the local directory "/Volumes/Macintosh\ HD/Users/truman/Downloads/". In order to do tht it usees the user truman to read the file on the remote system, asking you to provide a password - seems to be what you want?
>FWIW ...to copy a file in MacOS Shell I'd type... cp /location/file.ext /location/
Same on TNC, except ur copying from /location to /location so kinda useless
Btw - its better to ssh into TNC than using the webgui shell access (setup sshd) for running fio tests. Dont do config operations on cli though, and when creating pools u might need to import them.
Re your tests - its difficult to comment on them if you dont provide the command you run.
If you look at my output you see I get 5% read (rwmixread, there is also rwmixwrite) and 95% write. If you use randrw and dont specify a percentage then u get a 50:50 test
I get a result for Write and for Read. For me its consistent, for you its not.
Code:
fio --filename=random.fio --direct=1 --rw=randrw --bs=1M --size=100G --numjobs=4 --runtime=120 --group_reporting --name=yeeetiops --rwmixread=5 --thread --ioengine=psync
yeeetiops: (g=0): rw=randrw, bs=(R) 1024KiB-1024KiB, (W) 1024KiB-1024KiB, (T) 1024KiB-1024KiB, ioengine=psync, iodepth=1
...
fio-3.28
Starting 4 threads
yeeetiops: Laying out IO file (1 file / 102400MiB)
Jobs: 4 (f=4): [m(4)][100.0%][r=49.0MiB/s,w=1023MiB/s][r=49,w=1023 IOPS][eta 00m:00s]
yeeetiops: (groupid=0, jobs=4): err= 0: pid=111542: Fri Jun 16 16:45:11 2023
  read: IOPS=53, BW=53.8MiB/s (56.4MB/s)(6455MiB/120004msec)
    clat (usec): min=105, max=42039, avg=5490.46, stdev=2999.45
     lat (usec): min=105, max=42040, avg=5490.81, stdev=2999.46
    clat percentiles (usec):
     |  1.00th=[  210],  5.00th=[  359], 10.00th=[ 2343], 20.00th=[ 3720],
     | 30.00th=[ 4293], 40.00th=[ 4752], 50.00th=[ 5211], 60.00th=[ 5735],
     | 70.00th=[ 6325], 80.00th=[ 7111], 90.00th=[ 8586], 95.00th=[10159],
     | 99.00th=[15926], 99.50th=[19006], 99.90th=[26084], 99.95th=[29492],
     | 99.99th=[42206]
   bw (  KiB/s): min= 8160, max=131054, per=100.00%, avg=55810.00, stdev=5787.24, samples=945
   iops        : min=    4, max=  126, avg=51.51, stdev= 5.68, samples=945
  write: IOPS=1014, BW=1015MiB/s (1064MB/s)(119GiB/120004msec); 0 zone resets
    clat (usec): min=79, max=120483, avg=3600.82, stdev=2060.55
     lat (usec): min=105, max=120543, avg=3646.70, stdev=2062.63
    clat percentiles (usec):
     |  1.00th=[ 1450],  5.00th=[ 1827], 10.00th=[ 2040], 20.00th=[ 2442],
     | 30.00th=[ 2737], 40.00th=[ 2999], 50.00th=[ 3294], 60.00th=[ 3556],
     | 70.00th=[ 3851], 80.00th=[ 4293], 90.00th=[ 5211], 95.00th=[ 6325],
     | 99.00th=[11338], 99.50th=[15533], 99.90th=[22676], 99.95th=[27395],
     | 99.99th=[34866]
   bw (  KiB/s): min=177464, max=2301443, per=100.00%, avg=1040253.97, stdev=57143.82, samples=956
   iops        : min=  170, max= 2244, avg=1014.09, stdev=55.81, samples=956
  lat (usec)   : 100=0.01%, 250=0.28%, 500=0.28%, 750=0.24%, 1000=0.13%
  lat (msec)   : 2=8.00%, 4=63.11%, 10=26.53%, 20=1.22%, 50=0.22%
  lat (msec)   : 250=0.01%
  cpu          : usr=1.36%, sys=8.45%, ctx=1151530, majf=0, minf=0
  IO depths    : 1=100.0%, 2=0.0%, 4=0.0%, 8=0.0%, 16=0.0%, 32=0.0%, >=64=0.0%
     submit    : 0=0.0%, 4=100.0%, 8=0.0%, 16=0.0%, 32=0.0%, 64=0.0%, >=64=0.0%
     complete  : 0=0.0%, 4=100.0%, 8=0.0%, 16=0.0%, 32=0.0%, 64=0.0%, >=64=0.0%
     issued rwts: total=6455,121788,0,0 short=0,0,0,0 dropped=0,0,0,0
     latency   : target=0, window=0, percentile=100.00%, depth=1

Run status group 0 (all jobs):
   READ: bw=53.8MiB/s (56.4MB/s), 53.8MiB/s-53.8MiB/s (56.4MB/s-56.4MB/s), io=6455MiB (6769MB), run=120004-120004msec
WRITE: bw=1015MiB/s (1064MB/s), 1015MiB/s-1015MiB/s (1064MB/s-1064MB/s), io=119GiB (128GB), run=120004-120004msecit would have told you that
so your total bandwidth was 5G, ~500G per thread (which is why we need the command).
On TNC the performance that you see is per device (each disk), not per pool, so you need to add those up. Bear in mind that its not only the fio test thats writing but also metadata, that some parts are getting cached first or might not be written to all disks the same depending on pool layout. In my case (peak) perf per disk (5 disk z1 pool) was 283MB/s but it was not at that speed the hole 120s, so total perf per disk was lower.
But yes, TNC reporting is crap, if i run real test i tend to send that out to Grafana (via graphite plugin for node exporter). One thing missing from the perl script sadly, direct tsdb integration.
Anyhow, looking at your output without the command is difficult, its hard to say why ur per thread result is only 10% of total unless u ran 10 threads?
Also this is the point where to pool design and the relationship of test jobs to read/write #of vdevs begins to matter.
Ideally you should start simple, maybe by pointing fio to a raw device (filename = /dev/nvd0) or a single mirror to establish a baseline (or in your case verify the device is working even remotely as expected in TNC).
Cheers
Attachments
-
 278.8 KB Views: 0
Run status group 0 (all jobs):
READ: bw=53.8MiB/s (56.4MB/s), 53.8MiB/s-53.8MiB/s (56.4MB/s-56.4MB/s), io=6455MiB (6769MB), run=120004-120004msec
WRITE: bw=1015MiB/s (1064MB/s), 1015MiB/s-1015MiB/s (1064MB/s-1064MB/s), io=119GiB (128GB), run=120004-120004msec
thats the performance of about half a single sas drive
READ: bw=53.8MiB/s (56.4MB/s), 53.8MiB/s-53.8MiB/s (56.4MB/s-56.4MB/s), io=6455MiB (6769MB), run=120004-120004msec
WRITE: bw=1015MiB/s (1064MB/s), 1015MiB/s-1015MiB/s (1064MB/s-1064MB/s), io=119GiB (128GB), run=120004-120004msec
thats the performance of about half a single sas drive

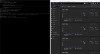
What was the Y axis ... what provided the graphed results for you here..? Obviously FIO doesn't give me this! lol.random write on a z1 pm863a 3.84 ssd pool, jobs=4 on an e3-1280v5 - Its fine for me, this is a low power box, sub 40W idle (including an m2 optane for slog and 40G uplink)
View attachment 29727
(don't tell me it's in that file I couldn't SSH to copy)
Last edited:
Indeed it was what I'd wanted, but the response made me nervous. As you saw I was in SSH; it's the only way I could copy something to local.Copies a file from 10.0.184.67 (sourcepath /root/fiotest) to the local directory "/Volumes/Macintosh\ HD/Users/truman/Downloads/".Code:>scp truman@10.0.184.67:/root/fiotest /Volumes/Macintosh\ HD/Users/truman/Downloads/
In order to do that it uses user truman to read the file on the remote system, asks you provide a password - seems to be what you want?
The reaction was just disconcerting and made me think it'd be better to test & get confident with that on a machine without live data on it.
As usual you're right: Included below.It's difficult to comment on if you don't provide the command you ran.
Code:
fio --filename=random.fio --rw=write --bs=128k --size=20G --numjobs=10 --runtime=120s --name=Im_an_idiotEven if the location I run it from is a vDev..?? How?
Nah, thats power utilization, based on librenms.What was the Y axis ... what provided the graphed results for you here..? Obviously FIO doesn't give me this! lol.
(don't tell me it's in that file I couldn't SSH to copy)
I dont have a nice way of displaying fio results yet. There are a couple of tools but they dont run without installing stuff usually.
The perl script would parse the results and provide an csv at least for consumation in excel (or ingest into a db).
Fio or TNC?You SURE the performance reported is PER drive..?
Even if the location I run it from is a vDev..?? How?
TNC knows the individual drives...

OpenZFS: Using zpool iostat to monitor pool perfomance and health
OpenZFS Using zpool iostat to monitor pool performance and health This is part of our article series published as “OpenZFS in Depth”. Subscribe to our article series to find out more about the secrets of OpenZFS Zpool iostat is one of the most essential tools in any serious ZFS storage...
 forums.freebsd.org
...
Going near-realtime with zpool iostat
The new arguments we fed zpool iostat are -y 1 1. The -y asks zpool iostat to discard its usual output of cumulative statistics entirely. The first 1 means to poll the system every second, and the second 1 means to only show a single poll’s statistics.
What we can see here is that our very heavily read-loaded pool is distributing reads roughly evenly to both mirror vdevs within data—and within each mirror vdev, roughly evenly between each disk. This is what we expect to see, and is a good indication our disks are in pretty good shape.
...
Fio does not report per drive but per job unless you have --group-reporting active, again from 1. fio - Flexible I/O tester rev. 3.35 — fio 3.35-6-g1b4b-dirty documentation
group_reporting
It may sometimes be interesting to display statistics for groups of jobs as a whole instead of for each individual job. This is especially true if numjobs is used; looking at individual thread/process output quickly becomes unwieldy. To see the final report per-group instead of per-job, use group_reporting. Jobs in a file will be part of the same reporting group, unless if separated by a stonewall, or by using new_group.
OKay, so it is testing the vDev ... yes?Fio does not report per drive but per job unless you have --group-reporting active, again from.
(Which was why I needed to navigate to the array's directory location).
Bc the damned 9300 Pro cause this stupid R7415 fans to go NUTS (10,000rpm) I went back to the 4x 7300 Pro I have (setup in RAIDz1) ... which basically get about the same performance as 8x of the 9300 Pro in RAIDz2. I'm going to pickup another 4x of the 7300s ... but here's what's weird: They have 2/3rds the Write performance of the 9300 Pro and the same Read performance apparently ...
7300 Pro: 2GBs W | 3.2GBs R
9300 Pro: 3GBs W | 3.2GBs R
Yet ... with only 4 of the 7300 Pro which are each only 2/3 the W performance of the 9300 Pro ... they get the same performance as the 9300 Pro ini RAIDz2 at ~600-700MBs. Which IMO ... is utter crap. My spinning array can get (over) that and always perform in excess of the single drive speed, between 200MB/s - 650MB/s ...(but they'll range from 200MB/s up to an avg high of 550MB/s) ... and we know spinning drives get ~150MBs at best.
The collective performance compared to individual device performance is terrible.
Judging by their performance' consistency (stays within ±50MB/s), they're spectacularly (vs spinning at ±200MB/s).
You expected they'd get a few GB per second just as I did.
I'm assuming it's not like Epyc CPUs are inherently slow or something.
NVMe aren't exactly slow individually ... I tested these in Windows & Ubuntu & got 2GBs Write.
That in TrueNAS, several drives together can't get the performance of one drive is counterintuitive.
Again ... system has 256GB of DDR4 ECC.
Could this possibly be a TrueNAS tunables issue ..?